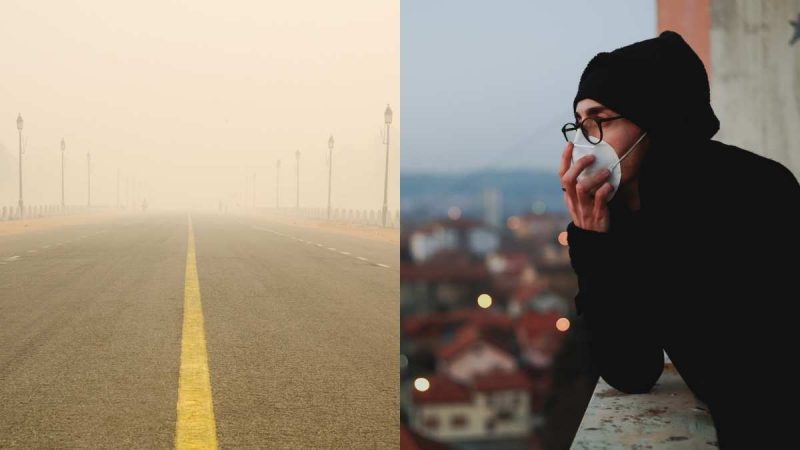
A new study by Respirer Living Sciences, a climate-tech startup for cleaner air, has revealed that the annual particulate matter (PM10) levels of major metropolitan cities in India have consistently exceeded national safety standards over the past four years. Reportedly, the National Ambient Air Quality Standards (NAAQS) sets the safe limit for PM10 at 60µg/m³. However, major Indian cities have been experiencing PM10 levels that surpass a whopping 200 µg/m³.
PM10 Levels Beyond Safety Limits
For better understanding, PM10 refers to particles with a diameter of 10 micrometres (µm) or smaller. Experts believe that short-term exposure to these particles is linked to worsening respiratory conditions like asthma and chronic obstructive pulmonary disease.
So, what is causing the PM10 levels to rise in Indian cities? Some of the key sources contributing to this are vehicular emissions, unregulated construction activities, waste burning, industrial operations, and seasonal phenomena such as crop residue burning and temperature inversions, particularly in North India.
City-Specific PM10 Limit Analysis
1. Delhi
Not so surprisingly, Delhi continues to record the highest PM10 levels among metropolitan areas. Anand Vihar, in particular, remains the most polluted site, registering PM10 levels ranging from 283.7 µg/m³ in 2021 to 272.0 µg/m³ in 2024. While there were some minor fluctuations in other areas, the overall air quality remains alarmingly poor in the city.
2. Patna
High vehicle density, diesel-run public transport, and open waste burning are some of the key factors contributing to Patna’s consistently high PM10 levels. The state’s Samanpura areas recorded a steady rise from 166.6 µg/m³ in 2021 to 250.0 µg/m³ in 2023. It declined slightly to 237.7 µg/m³ in 2024.
Also Read: Shreya Priyam Reveals Must-Visit Spots In Patna
3. Chandigarh
Increasing vehicular population and construction activities have added to Chandigarh’s worsening air quality troubles. All Chandigarh stations showed an increasing trend in PM10 levels between 2021 and 2024.
4. Lucknow
Like other North Indian cities, PM10 levels in Lucknow remained well above NAAQS. The Lalbagh area recorded consistently high values over 160 µg/m³. Major contributors to the city’s poor air quality were factors like unregulated construction dust, burning of waste and biomass, and traffic congestion.
5. Ahmedabad
Poor waste management and burning, and high industrial emissions led to Ahmedabad’s PM10 levels remaining high in the last four years.
Also Read: This Cafe In Ahmedabad Has A Unique Payment System! Eat For Free And Pay For The Next Customer!
6. Kolkata
While Kolkata’s PM10 levels show an overall decline, they are still way above safe limits. The Rabindra Bharati University area recorded a drop from 146.4 µg/m³ in 2021 to 86.7 µg/m³ in 2024.
7. Mumbai
High construction activity, heavy traffic congestion, industrial and port-related pollution, and coastal humidity affecting particulate suspension are the key factors contributing to Mumbai’s rising PM10 levels.
8. Pune
Pune shows significant variations in PM10 levels across the city. For example, Karve Road saw a 177.6% increase from 50.0 µg/m³ in 2021 to 138.9 µg/m³ in 2022, before dropping to 99.6 µg/m³ in 2024. Meanwhile, Alandi station had a 42.1% increase in PM10 from 2022 to 2023, followed by a 30.1% decline in 2024, highlighting high spatial and temporal variability.
Also Read: Pune: Expansion Work Along Pimpri-Nigdi Metro Route Lead To Traffic Congestion In The Area
9. Hyderabad
Hyderabad saw a mixed trend. Kokapet saw a rise from 50.4 µg/m³ in 2021 to 84.8 µg/m³ in 2024, whereas Central University showed a decline in its PM10 levels in 2024.
10. Bengaluru
In Bengaluru, IT corridor traffic congestion and dry weather conditions worsened dust suspension and resulted in high PM10 levels.
11. Chennai
Chennai had relatively lower PM10 levels, however, most areas still exceeded NAAQS. For example, Alandur Bus Depot saw an increase from 56.3 µg/m³ in 2021 to 81.8 µg/m³ in 2024.
Also Read: Regena Cassandrra Shares Her Go-To Food Joints In Chennai; Recommends These Places For A Grand Feast
What are your thoughts on this report? Let us know in the comments.
Cover Image Courtesy: Canva (representative image)

